Center for Social Innovation

California’s 39th district incorporates portions of Los Angeles, San Bernardino and Orange Counties and is home to a large and growing Asian American and Pacific Islander community – 33 percent of district residents are AAPI according to the American Community Survey. In 2016, Asian Americans comprised 15 percent of voters who cast a ballot. In that year, Republican incumbent Congressman Ed Royce was sent back for his final term, while presidential candidate Hillary Clinton narrowly defeated Trump. In 2018, the Latino Democrat Gil Cisneros flipped the seat only to see it return to Republican control this year by Korean American Young Kim.
What role did AAPIs play in the outcome of these elections?
The National Asian American Survey and AAPI Data have pioneered the use of survey data to develop a national portrait of the experiences and nuances of AAPI political participation and preferences. But national surveys have their limitations. It’s expensive to do them well and conduct them in multiple languages. Additionally, they are limited in their ability to capture local-level variations, such as voter preferences in this congressional district. In addition, we struggle to know how AAPI voters might differ in Southern California, San Jose, New Jersey, Houston, or Atlanta.
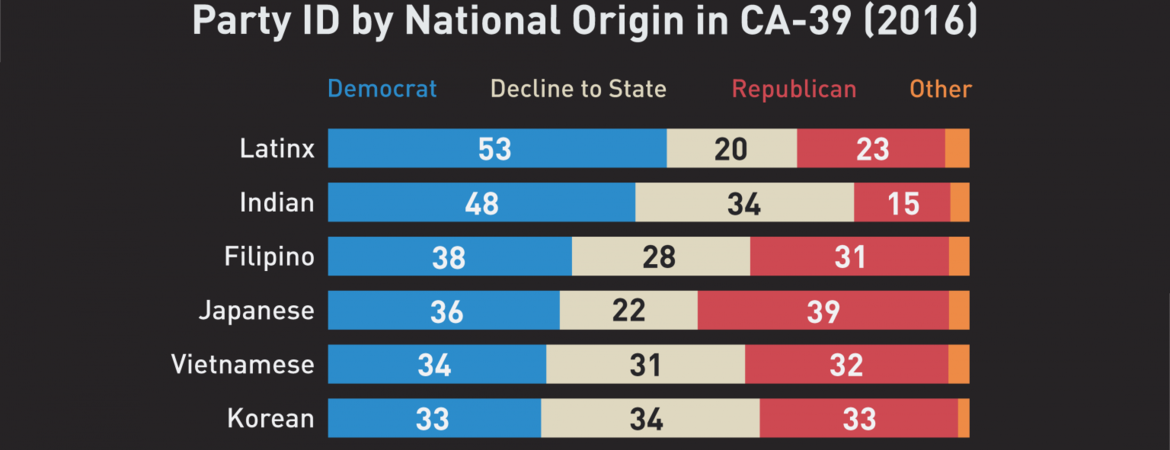
Analyzing voter data allows us to put the national portrait under a microscope. Media coverage of the matchup between Cisneros and Kim portrayed the race as being between a Latino and an Asian, glossing over the fact that AAPIs are diverse. In 2016, the largest number of Asian American voters in the district were Chinese American Americans (16,373), followed by Korean Americans (6,607), Filipino Americans (5,244) and Indian Americans (4,048). A simple analysis of voter registration data in the district shows that the majority of Chinese Americans, the largest subgroup of Asian voters, are not registered with either of the two major parties.
Using surname-matched voter data available from California’s Statewide Database at UC Berkeley’s School of Law, I employ the statistical method of ecological inference to analyze support for candidates by race and ethnicity.
Asian Americans Bought the Blue Wave in 2018
In the 2016 election, 61% of Asian Americans supported Republican incumbent Ed Royce, but simultaneously 68% of Asian Americans supported Democratic candidate Hillary Clinton.
In prior elections analyzed, the findings indicate Asian Americans offered consistent support to Royce across multiple elections with one exception: Chinese American Democrat Jay Chen on the ballot in 2012. Chen did particularly well among Asian Americans voters generally and Chinese American voters in particular, signaling that Asian American voters may have a distinct preference for Asian American candidates regardless of party affiliation. Chen garnered 62% of the Asian American vote and an estimated 95% support from Chinese American voters.
Some may have assumed that Chinese support for Chen would translate into support for Korean American Young Kim. But my analysis of 2018, does not support such an argument. Cisneros won by only 7,611 votes. I find that the majority of Asian Americans supported Cisneros, forming a coalition with Latinx voters who overwhelmingly supported Cisneros and every Democratic party candidate in the last four elections. This support coalition includes 62% of Chinese Americans, which suggests that Asian Americans didn’t simply “support one of their own” in this district and without the AAPI vote, Cisneros would have lost. See more of this analysis here.
Assessing the Impact of the Asian American vote in 2020
In 2020, Cisneros and Kim faced off again, and this time Kim had the upper hand. Did Asian American voters’ preferences change over the last two years? Did greater voter turnout spur the Republican victory? Soon to be released voter data will help us answer these questions and allow us to dig deeper and understand more about the landscape of AAPI political behavior.